Animations
Bases: how it works
An animation is a "frames collection":
- each frame can be generated by a time-dependent function (a parametric equation);
- the parameter must be a vector (a column matrix).
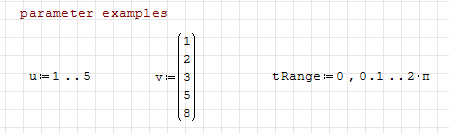
Parametric equations can be mono-parametric or multi-parametric.
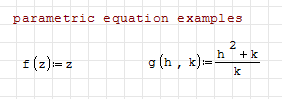
When you plot an animation, the animation parameter must be defined as "t".
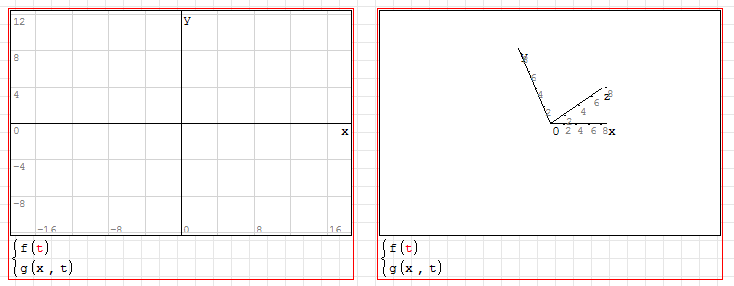
Right-click on your plots to define the animation settings:
- Parameter source: Animate > u / v / tRange (in this example, any other vector in your file) — each frame then takes a progressive position of the source variable as the "t" value.
- Animation speed: Frame rate > ### (e.g. "frame rate > 2" means 2 frames per second).
- Loop settings: Frame rate > No animation / Play once / Repeat Indefinitely — selecting "No animation" lets you see each frame step-by-step with ALT+left / ALT+right.
Examples
2D plot, frame source v, frame rate 2:
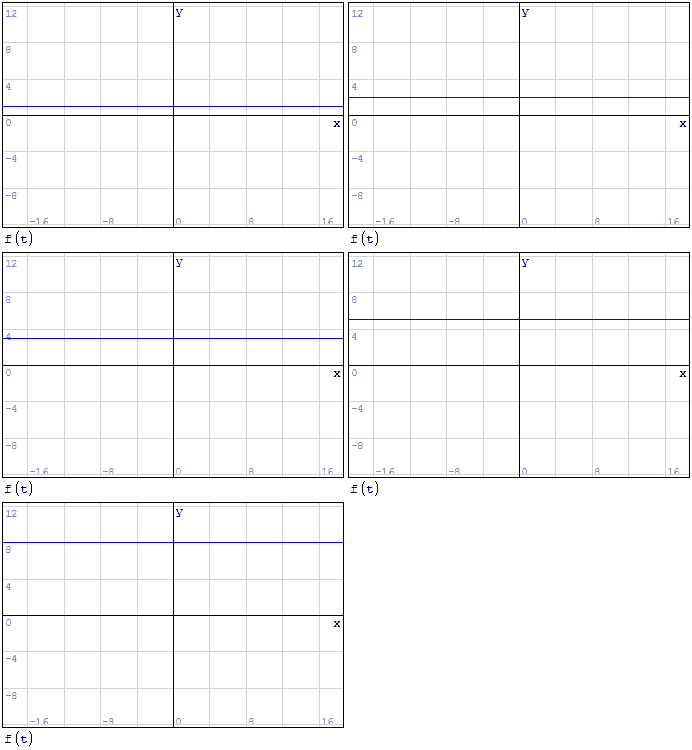
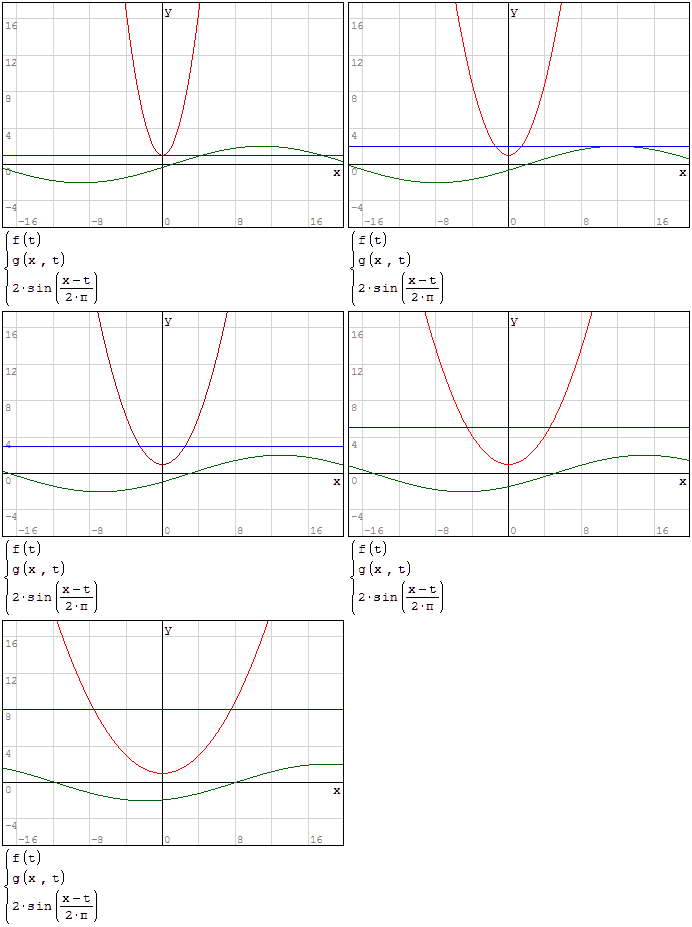
2D plot with multiple equations, frame source v, frame rate 5:
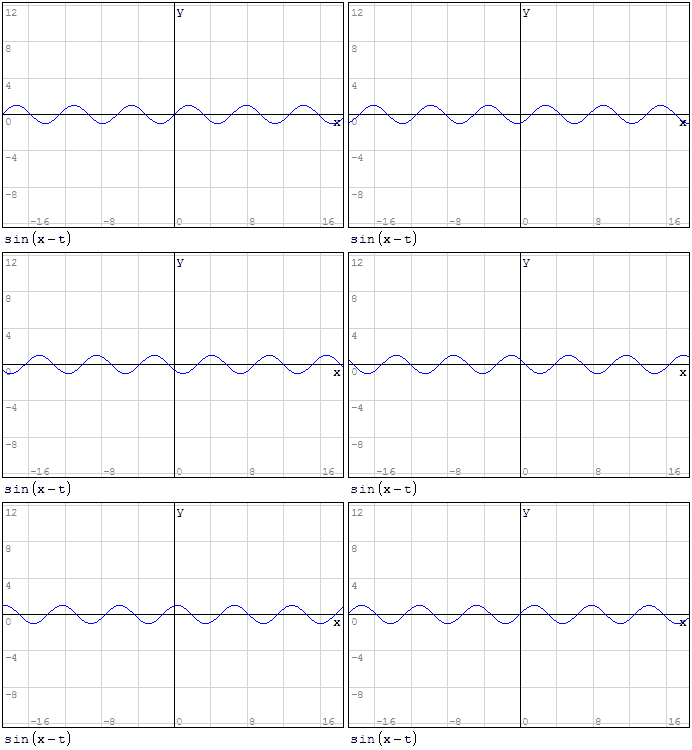
2D plot, frame source tRange, frame rate 50:
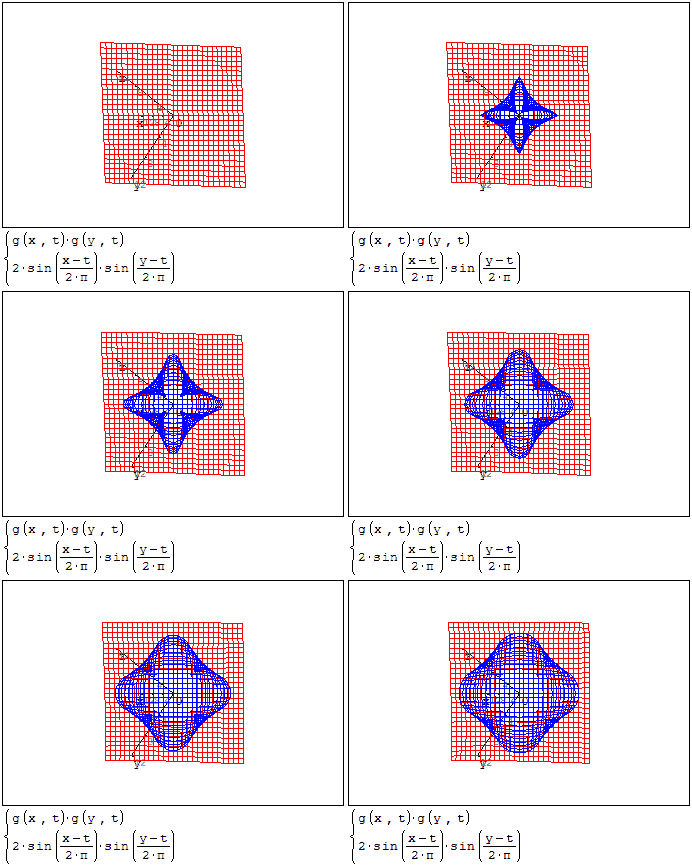
3D plot with multiple equations, frame source tRange, frame rate 50:
This page is based on a legacy wiki article by Davide Carpi.