Graphs
How to add an empty graph
You can add a 2D/3D graph from the menu: Insert > Plot > 2D / 3D.
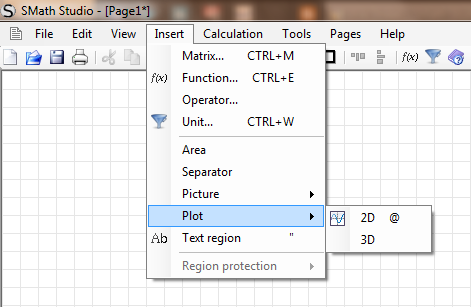
A 2D graph can also be added directly by typing @.
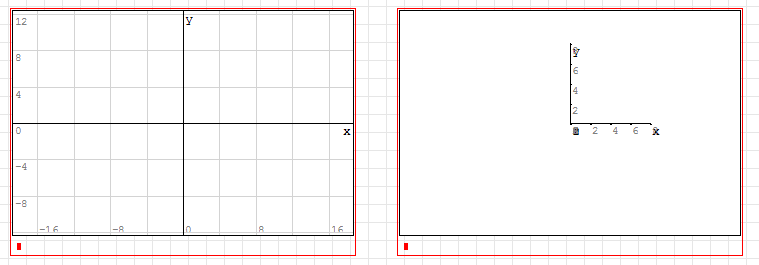
Now an empty graph will be added:
Plot equations
Variables to plot equations must be:
- x for 2D graphs
- x and/or y for 3D graphs
- t to animate 2D and 3D graphs
Note: variables are case sensitive (x is different from X).
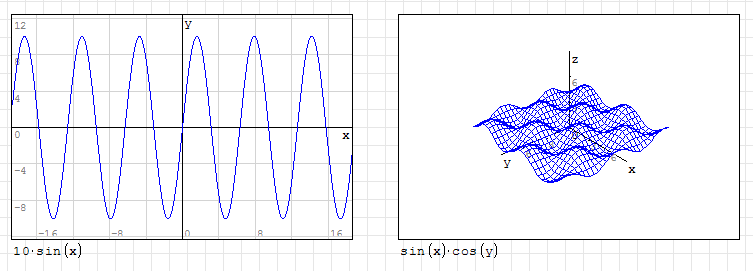
You have multiple ways to plot equations — directly from the plot window:
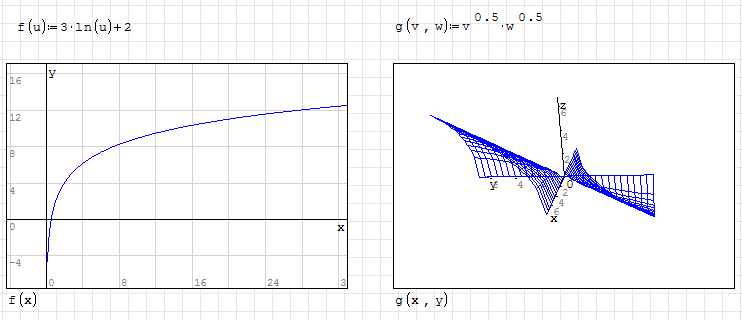
or indirectly, building your equation outside the plot window:
Plot matrices
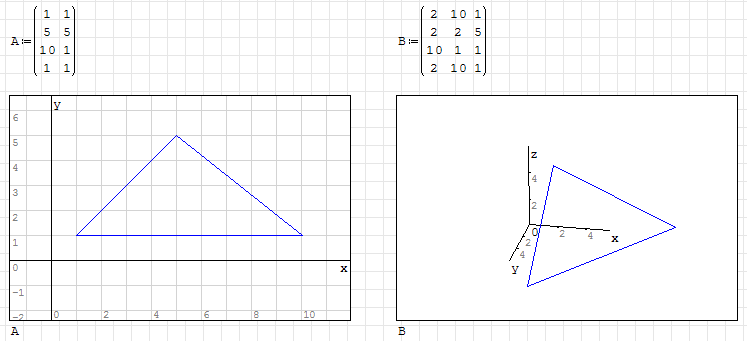
You can plot figures from matrices (directly or indirectly):
- 2-column matrices for 2D plots
- 3-column matrices for 3D plots
Multiple plots
You can plot multiple equations/matrices on the same graph using the Multiple values item on the Functions toolbox:
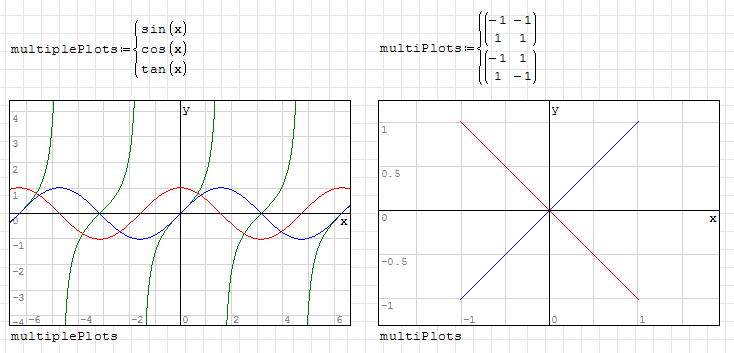
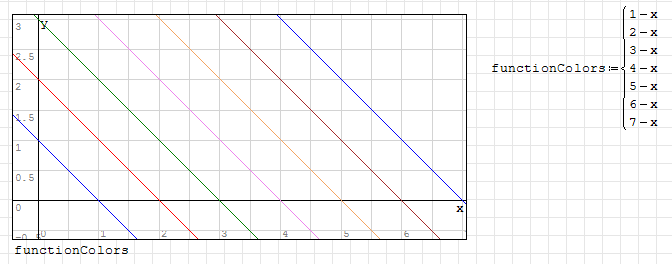
Each "value" is colored differently (cycling between 6 colors, in the following order: blue, red, green, magenta, orange, and brown).
Special plots (words, points, colors...)
You can plot words or characters (strings) on your 2D graphs.
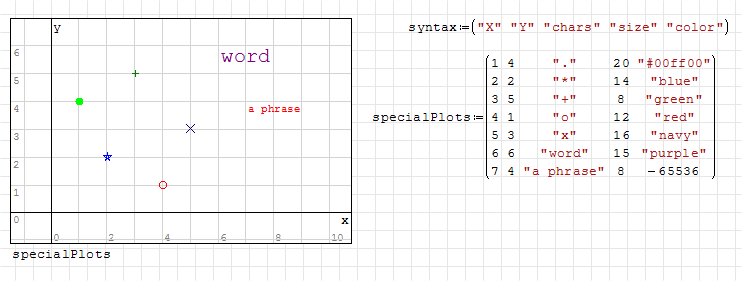
- Special characters (case sensitive) have their position fixed on the center of the given coordinates: + . * o x.
- Words, phrases, or non-special characters have the top-left corner of their (virtual) textbox fixed on the given coordinates.
- Size and color columns are not required (so you can use a 3, 4, or 5 column matrix).
- Values of the size column are absolute, so the resize action does not affect the appearance of special plots.
- Many colors are allowed, using web format (like "#6699CC" or "#FF6699CC") or by name.
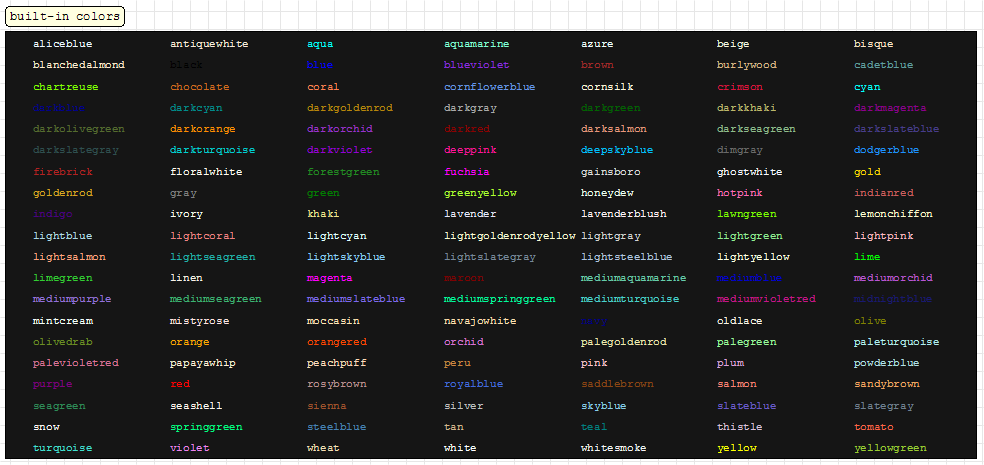
Note: you can use darkblue, DarkBlue, Dark Blue (recommended), DARKBLUE, D a R k B l U e, etc. — all spaces will be removed and the color name will be converted to lowercase.
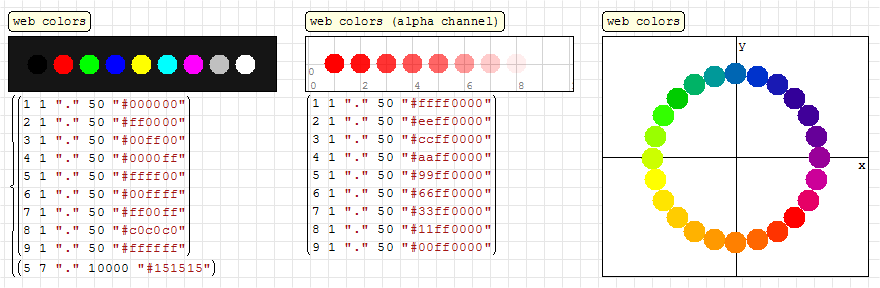

Note: web colors are allowed in either hexadecimal RGB ("#RRGGBB") or hexadecimal aRGB ("#aaRRGGBB") format.
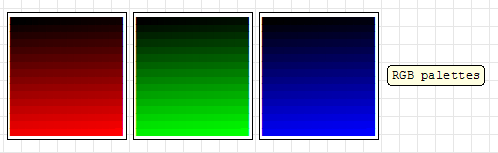
Note: you can use a number instead of a color name or web color. The number composing rule is a bit complex, but similar to web colors: the color is represented as a hexadecimal number where the first pair is opacity, the second pair is the red component, the third pair is the green component, and the fourth pair is the blue component. For example, FF00FF00 is a full-opacity green color (FF 00 FF 00). When you have a hexadecimal number, you need to convert it to a decimal number to use it in SMath Studio. Note that since the maximum 32-bit integer is 2147483647 (0xFFFFFFFF/2) and FF00FF00 = 4278255360 (i.e. greater than the max integer), green is FF00FF00-0xFFFFFFFF-1 = -16711936.
Animated plots
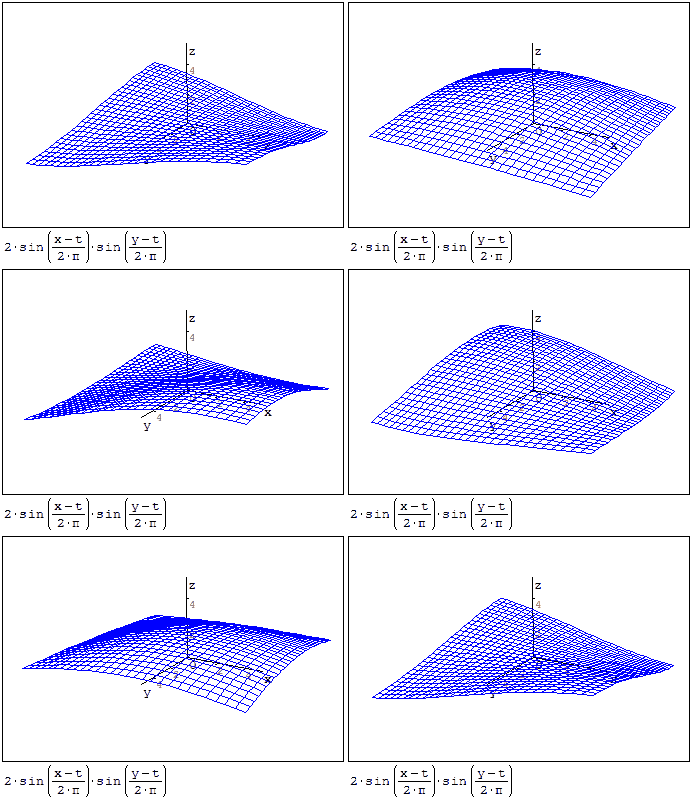
See animations.
Plot domains
If you want to define a plot inside a specified domain, you can follow two approaches — using an if/else statement:
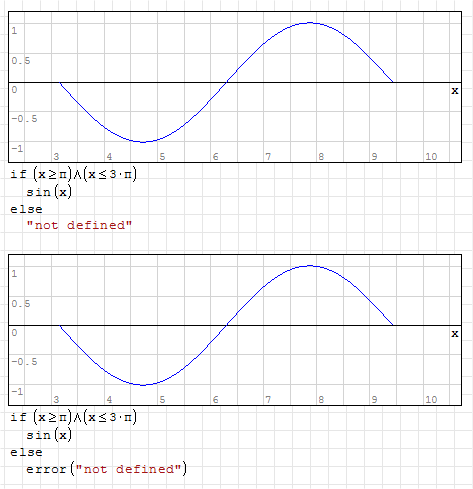
Note: any text (empty or not) or message from the error() function will be ignored.
Or using booleans as function parameters:
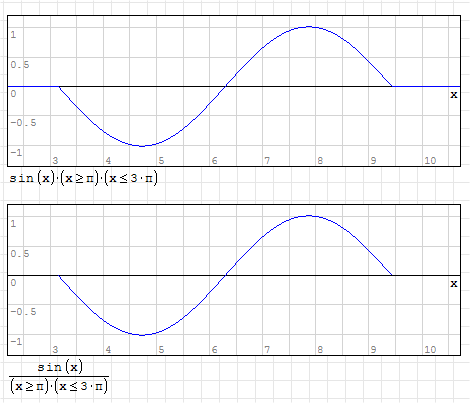
Note: infinite values will be ignored.
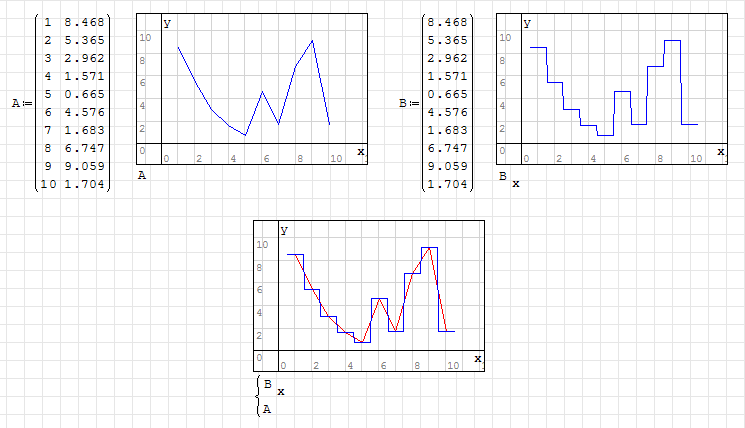
Plot vectors by index
It is possible to plot a single column vector using the x variable as an index.
In the plot, any x value will be rounded and, if possible, the corresponding vector element will be used as the y value:
Units
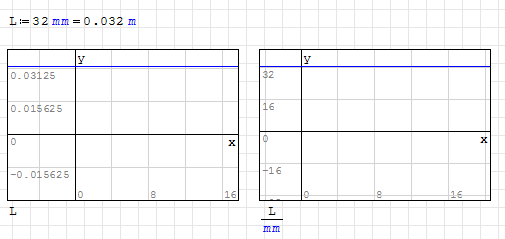
It is possible to use units of measurement inside plots.
Because the output units of calculations are base units (e.g. meters for any length unit), you have to scale the input or adjust the viewport.
Plot handling
A dedicated plot palette allows some operations on the graph.
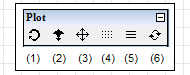
- Rotate: rotate 3D graphs.
- Scale: if you roll your mouse wheel it zooms both axes together. If you hold the 'control' keyboard key (CTRL) at the same time it zooms only the vertical axis; if you use the mouse wheel while holding the 'shift' keyboard key (↑) it zooms the horizontal axis. This does not affect the appearance of special plots.
- Move: drag the graph up or down, left or right; by default you can also move the graph by clicking and holding the left mouse button on it.
- Graph by points: show functions/straight lines as a set of points; useful to highlight discontinuities.
- Graph by lines: show functions/straight lines as lines (default).
- Refresh: restore the default view of the graph (axes origin moved to the graph center and zoom reset to default limits).
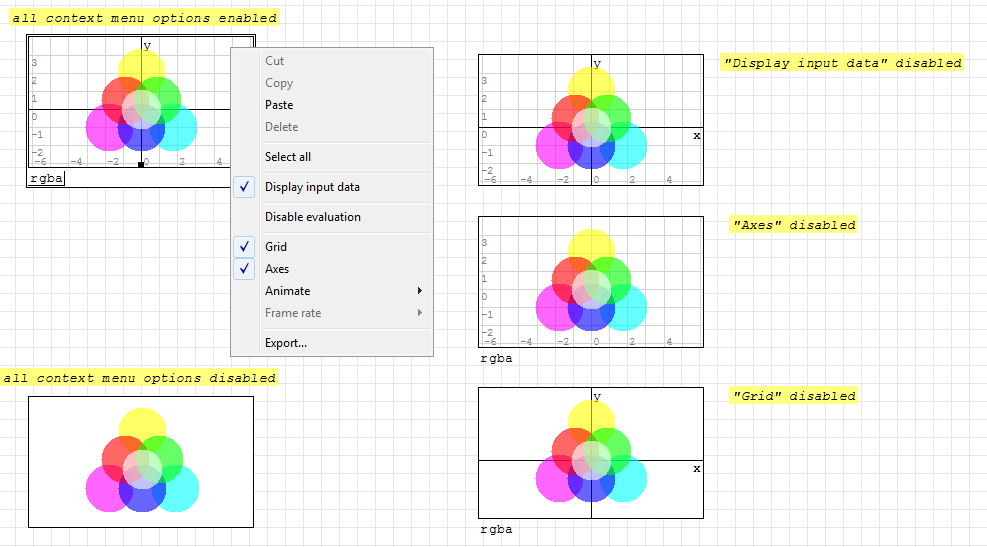
Right-clicking on the graph brings up a context menu with other options.
This page is based on a legacy wiki article by Davide Carpi.